Posthog <> ChatDB
Hi! 👋 Good to see you!
Here at ChatDB, we use Posthog to track daily and weekly active users, user growth and retention, and website references to ChatDB. With Posthog, we export the data and analyze it using ChatDB!
Posthog is an open-source platform made for your products. They offer many features, but for this, we will be utilizing their Product analysis toolset.
In the following tutorial and demo, we'll show you how you can use ChatDB and Posthog to understand your products and users better.
Connecting Posthog and ChatDB #
-
First things first, you're going to need to set up your product with Posthog and start collecting data.
-
Once you have a dataset you're happy with, we can start to export the data. Exporting your Posthog data to a .csv is simple. Simply find the Insight you want to analyze, hit the ... in the top right corner, then Export -> .csv
-
Next, we're going to need a Postgres or MSSQL database. If you don't already have one, Neon provides free Postgres databases with a large knowledgebase of documentation to answer any questions you may have while creating and importing your .csv files.
-
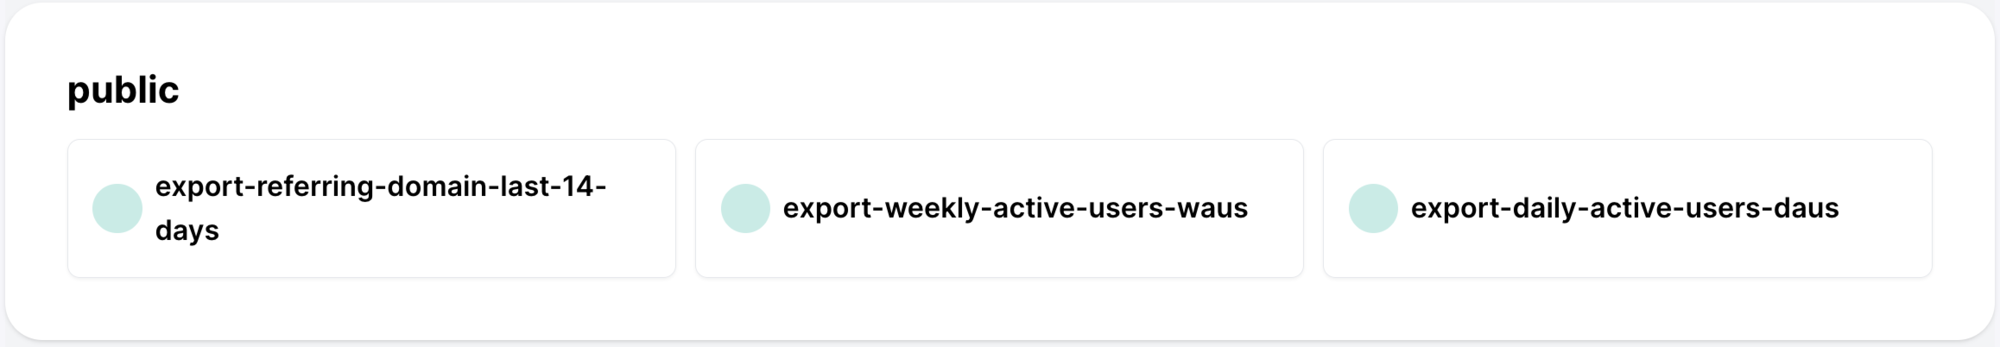
Finally, we can connect the database to ChatDB and find all of our imported .csv files right in our dashboard!
Analyzing with ChatDB #
Now that we have our data in ChatDB eager to be queried, let's start exploring!
Daily Active Users #
For any product, Daily Active Users (DAU) is one of the most important metrics to understand how your product is doing. We're going to use ChatDB to find out what our daily active users look like.
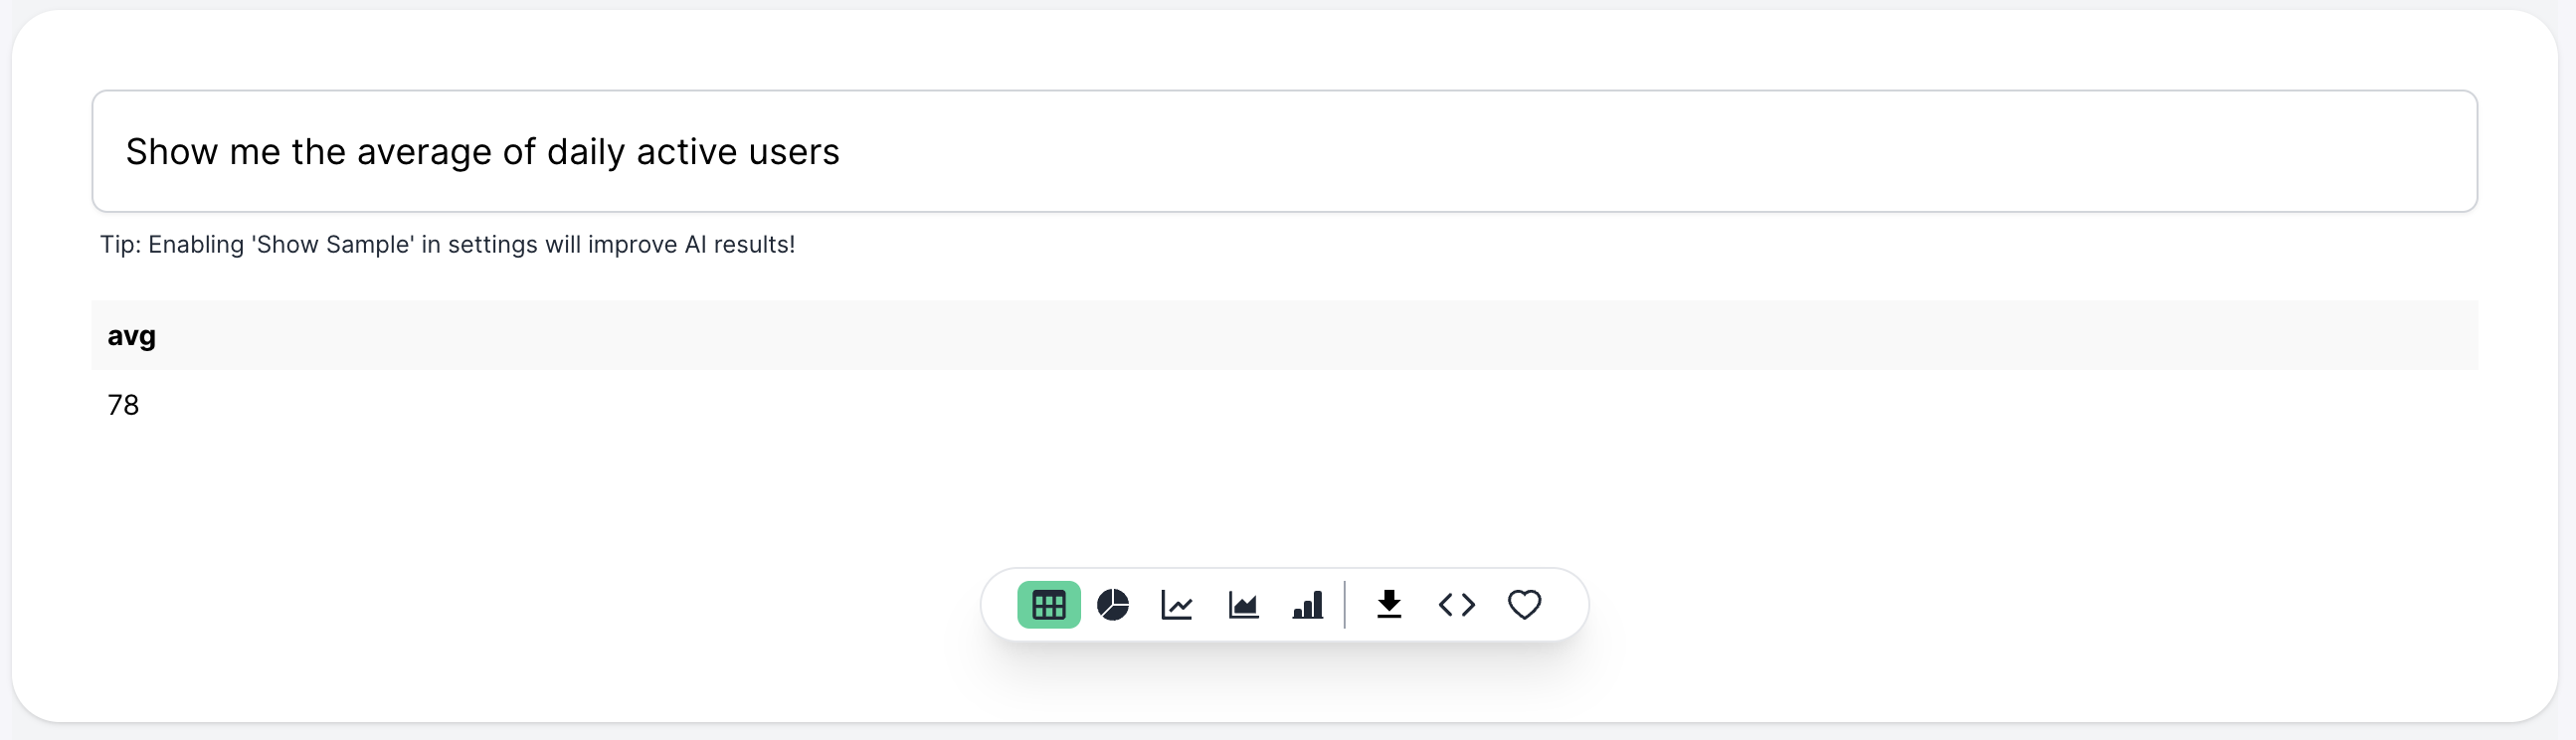
Here, we can see that we have a current average DAU of 78. The query it gave us also saved us a lot of time, compared to writing it by hand!
SELECT
  AVG(daily_average)
FROM
  (
    SELECT
      (
        "12-Nov-2023" + "13-Nov-2023" + "14-Nov-2023" + "15-Nov-2023" + "16-Nov-2023" + "17-Nov-2023" + "18-Nov-2023" + "19-Nov-2023" + "20-Nov-2023" + "21-Nov-2023" + "22-Nov-2023" + "23-Nov-2023" + "24-Nov-2023" + "25-Nov-2023" + "26-Nov-2023" + "27-Nov-2023" + "28-Nov-2023" + "29-Nov-2023" + "30-Nov-2023" + "1-Dec-2023" + "2-Dec-2023" + "3-Dec-2023" + "4-Dec-2023" + "5-Dec-2023" + "6-Dec-2023" + "7-Dec-2023" + "8-Dec-2023" + "9-Dec-2023" + "10-Dec-2023" + "11-Dec-2023" + "12-Dec-2023"
      ) / 31 AS daily_average
    FROM
      export_daily_active_users_daus
  ) subquery
We can also have ChatDB graph the data for us for an upcoming presentation!
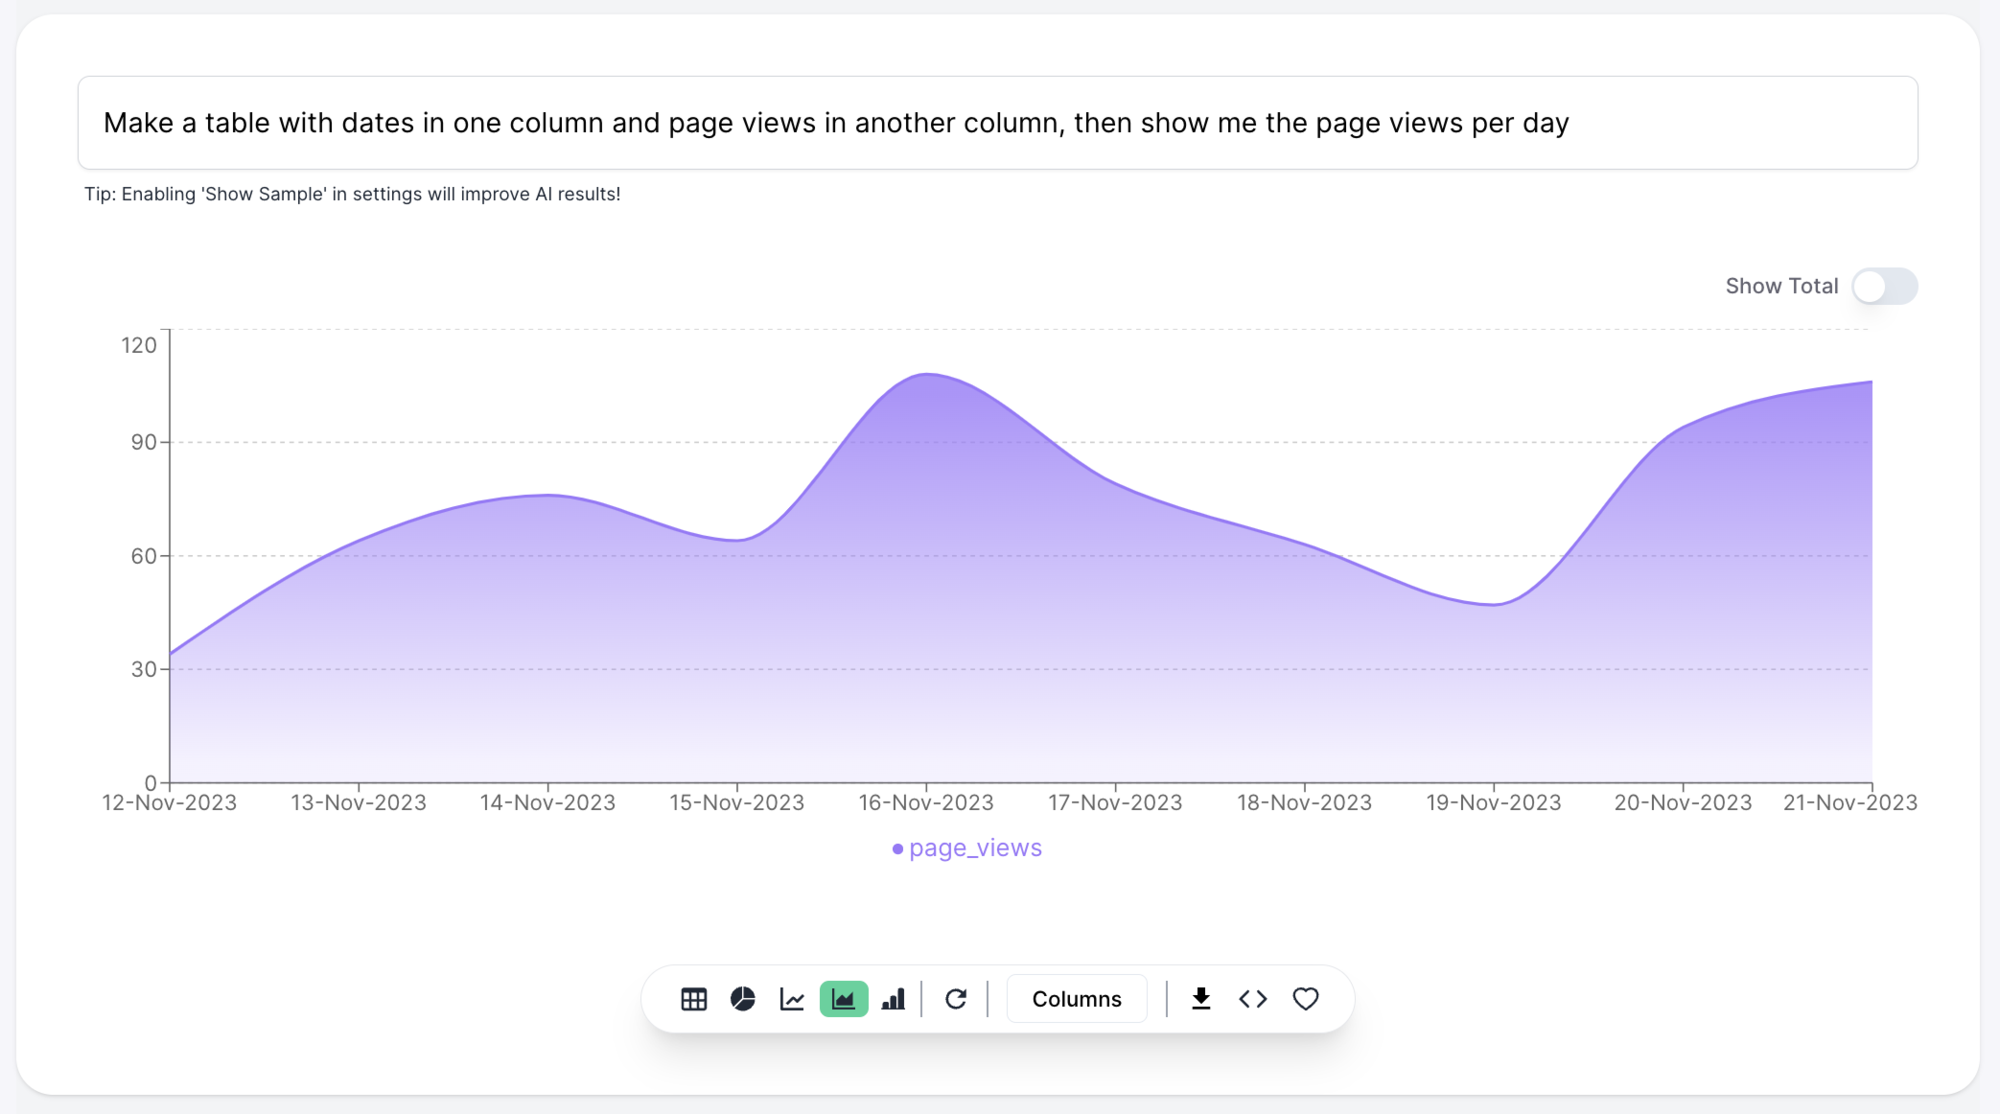
This graph not only demonstrates ChatDB's graphing ability but also converts the poorly formatted data Posthog gave us into something usable.
Top Referring Websites #
SEO is another crucial aspect of managing your product. You may also have online social media campaigns or posts on other websites. Lucky for us, Posthog can track which domains refer people to us. We can export this data and analyze it using ChatDB!
First, let's make a pie chart with the data.
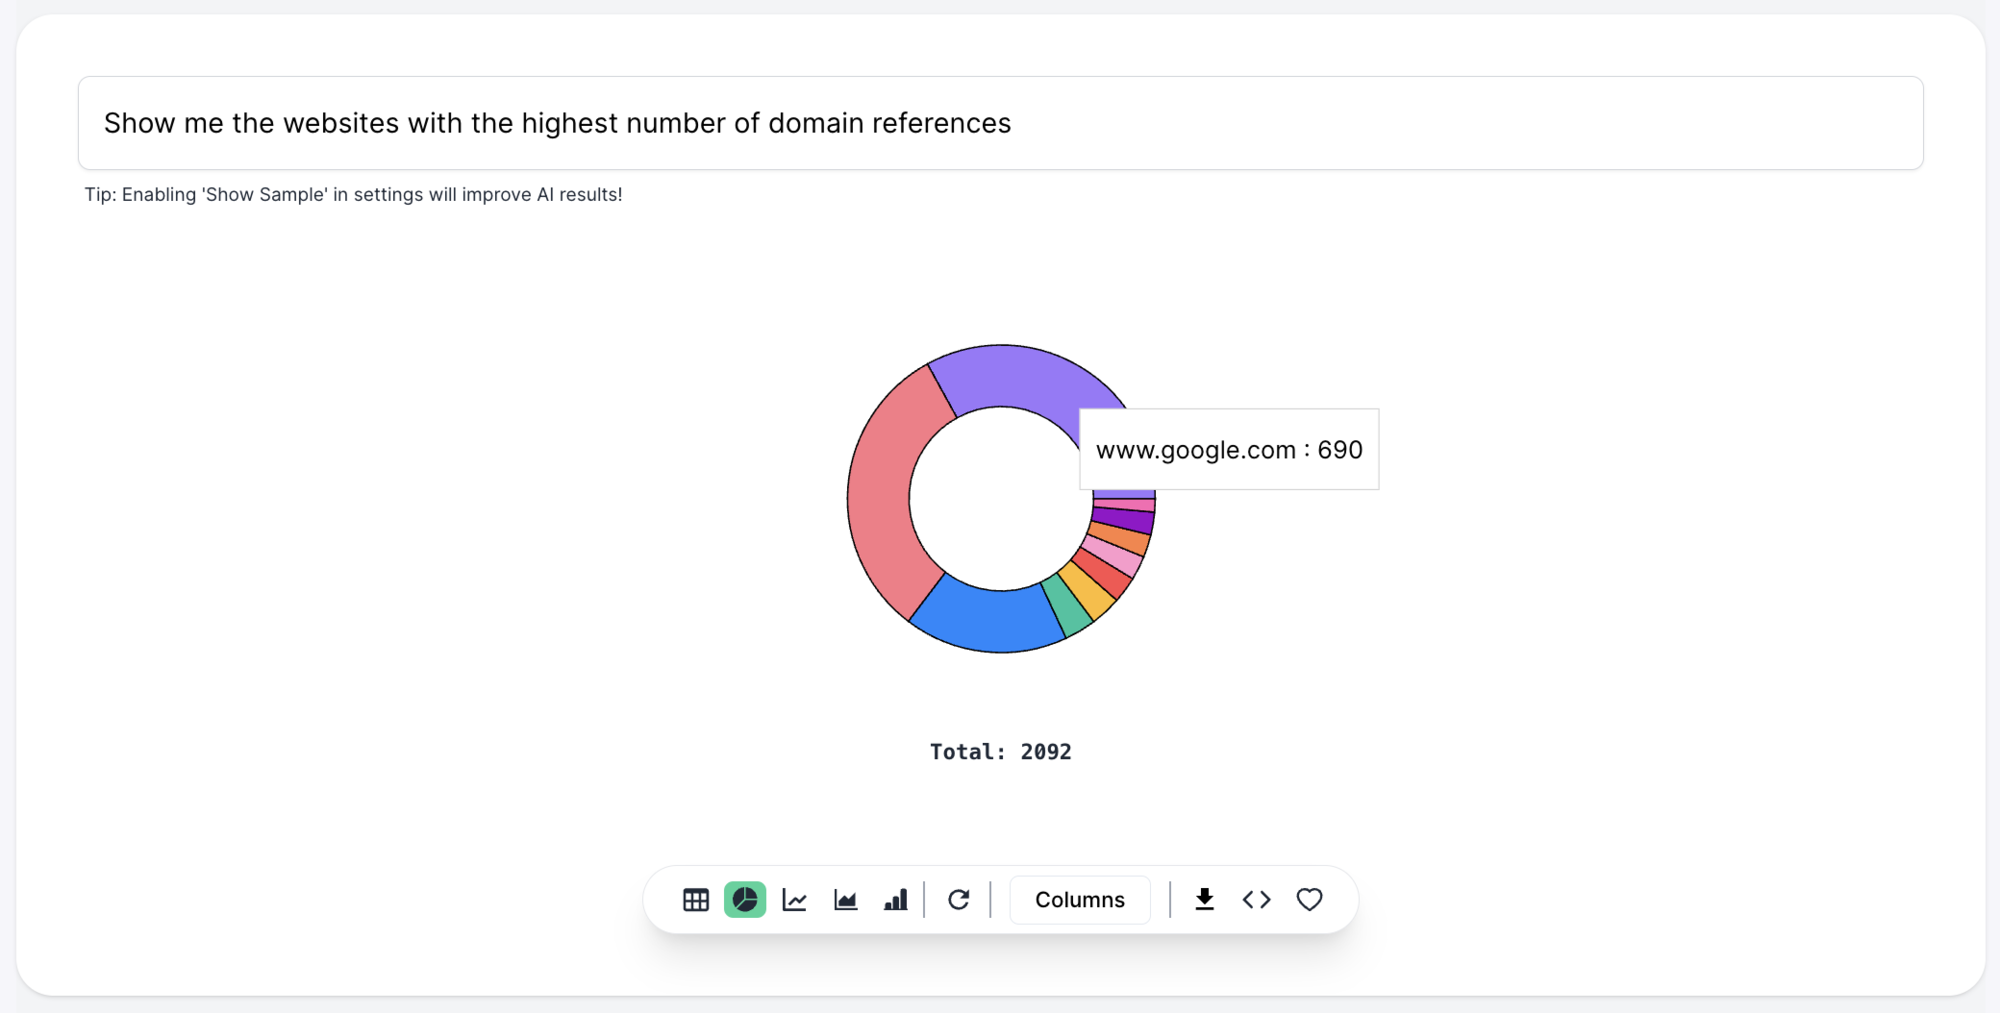
We can see here that most of our references are from Google, a good sign our SEO is well-optimized.
Conclusion #
With Posthog and ChatDB, the sky is the limit as to what you can do for your product. Posthog provides excellent logging for your product that can be used with ChatDB to query, analyze, and find trends and patterns.
Follow us on X for updates and sneak peeks into our latest features and for more ways ChatDB can be used to improve your product!