Querying the LA Crime Database with GPT-4
One of the biggest hurdles in data-driven decision-making is the need for SQL knowledge. Our mission at ChatDB is to simplify that process, making it accessible to everyone, regardless of their technical skills.
Let's take an open source dataset, LA Crimes Dataset, and connect it to ChatDB so we can understand the data!
Top 10 Crimes Breakdown #
Our first query aimed to understand the most common types of crimes in LA. ChatDB simplified what would have been complex SQL queries into a simple question: "What are the top 10 most common crimes in LA?"
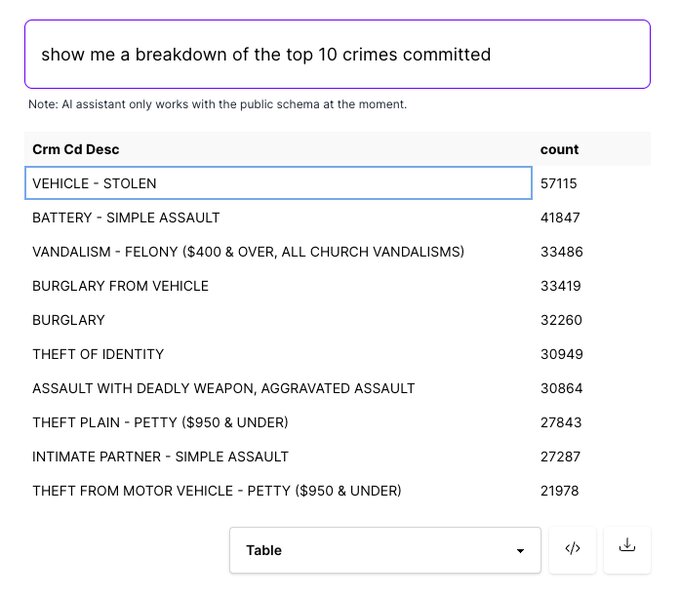
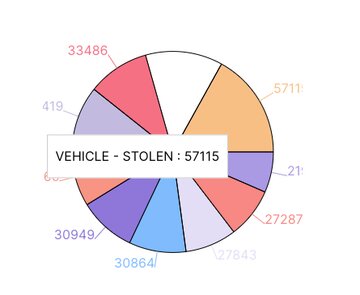
The data clearly shows that stolen vehicles rank as the most frequent crime. And the best part? You can visualize this data through various lenses, whether it’s a table, pie chart, or bar chart.
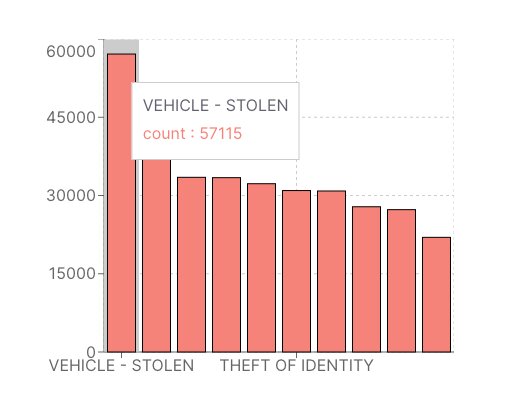
If pie charts aren't your thing, ChatDB also lets you switch to a more conventional bar chart to better compare the frequency of these crimes side-by-side.
Top 5 Most Common Ages of Victims #
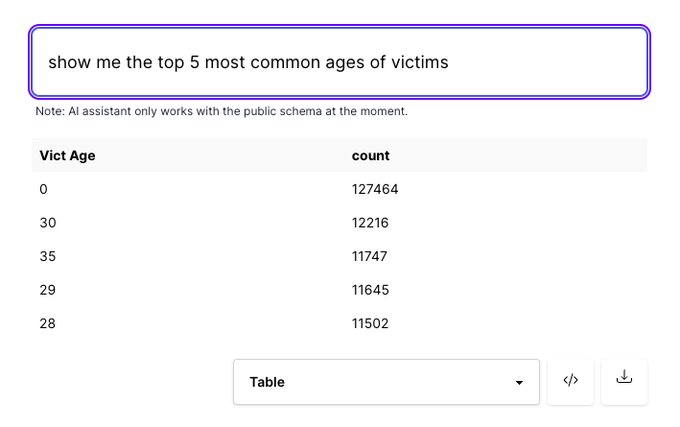
Understanding the demographics of crime victims can be incredibly valuable for targeted community support. By asking ChatDB, "What are the most common ages of crime victims?", we found that apart from the default value of 0, the late 20s and early 30s are the most vulnerable ages.
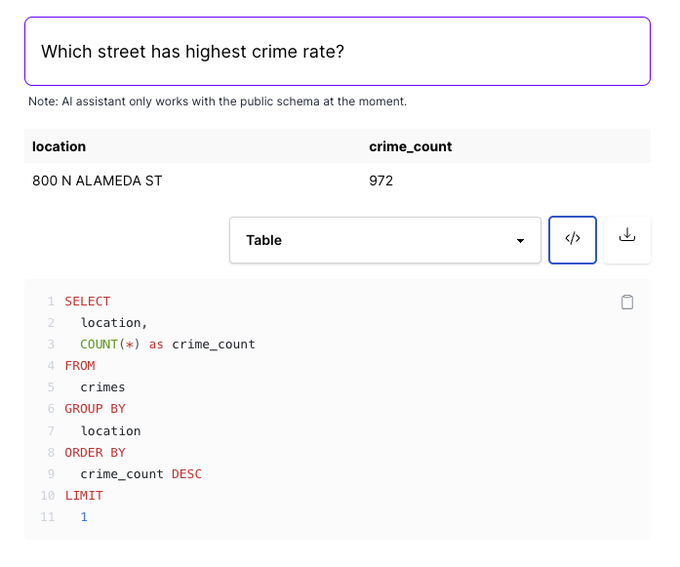
Street with the Highest Crime Rates #
To better understand crime distribution, we queried, "Which street has the highest crime rate in LA?" The result? 800 N Alameda St has the most recorded crimes.
We can also view the SQL code it used to find the answer
Conclusion #
Here at ChatDB, we are committed to breaking down the barriers between you and your data. No SQL, no problem. With natural language querying and custom dashboards, the Los Angeles Crime Database became an open book, and the same can happen for your databases too.
For more updates, stay tuned, and let us know what other databases you’d like us to explore next!