Analyzing Your Customer's Data with ChatDB
One of the biggest hurdles in data-driven decision-making is the need for SQL knowledge. Our mission at ChatDB is to simplify that process, making it accessible to everyone, regardless of their technical skills.
We're going to use an open-source customer spending habit database to show you how you can apply ChatDB to understand and analyze your data.
This database shows customer information in a .csv format with these headings:
Customer ID,Age,Gender,Item Purchased,Category,Purchase Amount (USD),Location,Size,Color,Season,Review Rating,Subscription Status,Shipping Type,Discount Applied,Promo Code Used,Previous Purchases,Payment Method,Frequency of Purchases
Most Popular Items for a Specific Demographic #
Understanding your customers wants and your own most sold items is important for staying competitive.
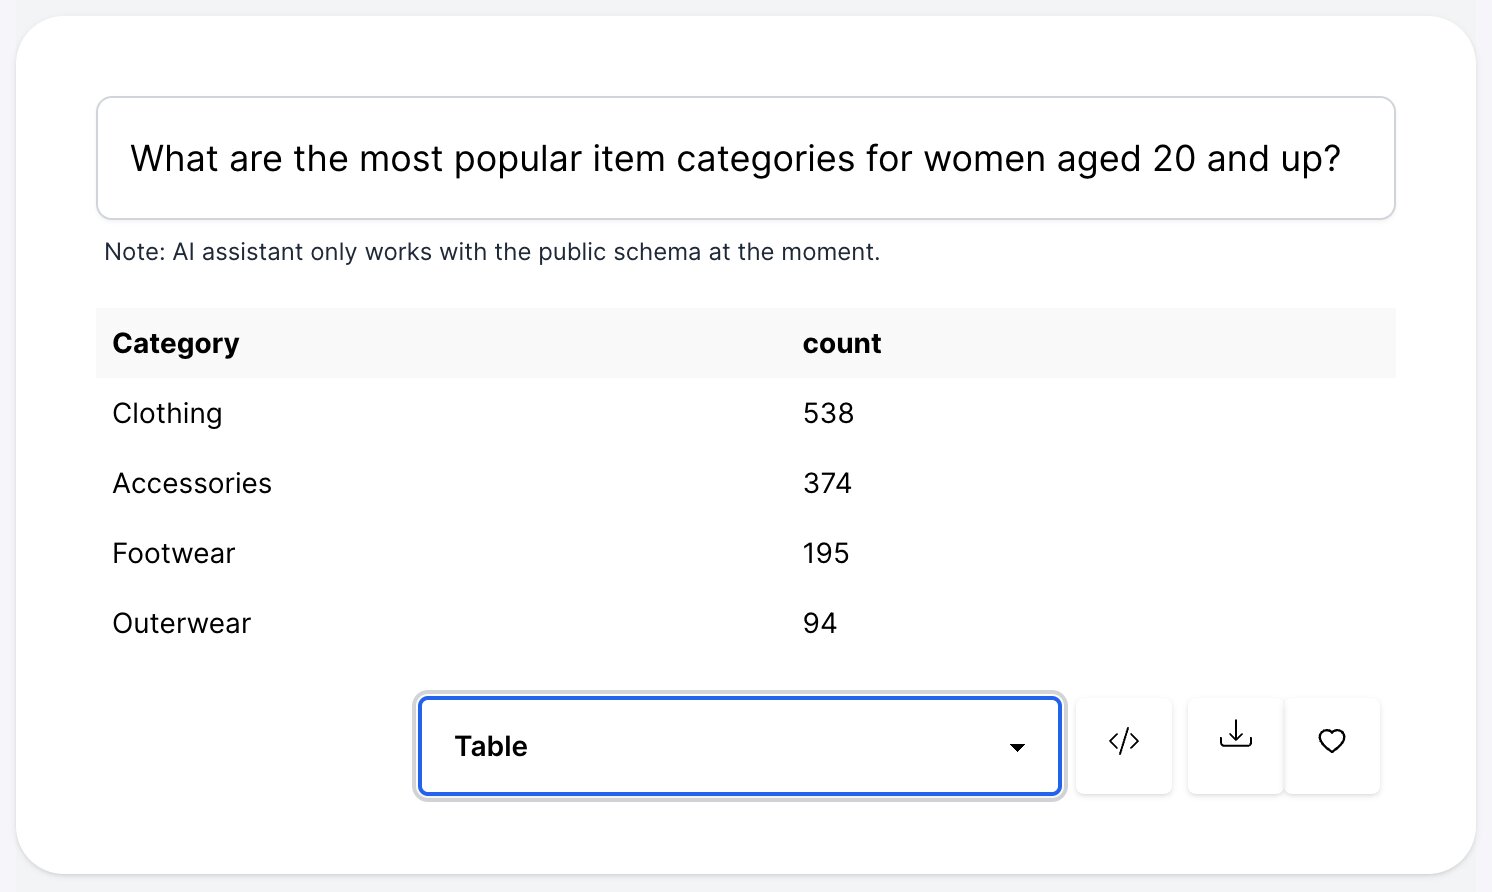
Let's first look at what the most popular item categories are for Women above the age of 20 with our first query What are the most popular item categories for women aged 20 and up?
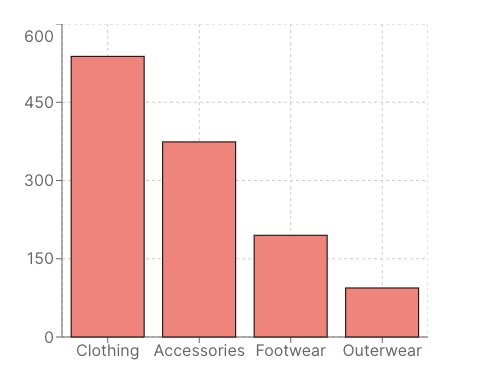
The data above shows that clothing is by far the most popular item category purchased by this specific demographic. If you are looking for something more visual, you can use ChatDB to generate different graphs using the analyzed data. Let's try a bar graph!
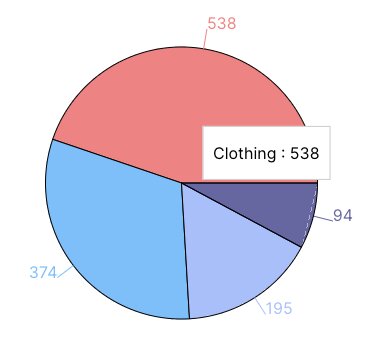
If you're looking for something more concise, we can try a pie chart instead!
After viewing this query, we can see just how easy ChatDB makes it to easily and quickly analyze and visualize your data. Let's see what else we can discover about this data.
What Is The Most Popular Item During a Specific Season? #
Understanding the most popular item for different seasons could be important for targeting different items to different seaons. Let's try to query a list of the top 5 purchased items for the spring season.

Now, let's visualize this data to make it easily digestable.
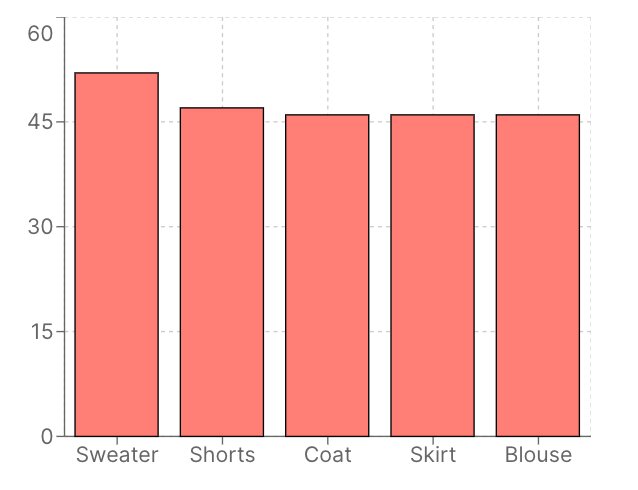
Using this data, we can conclude that sweaters are the most popular item in the spring, so we should probably prioritize selling them during the spring!
Using ChatDB for More Specific Queries #
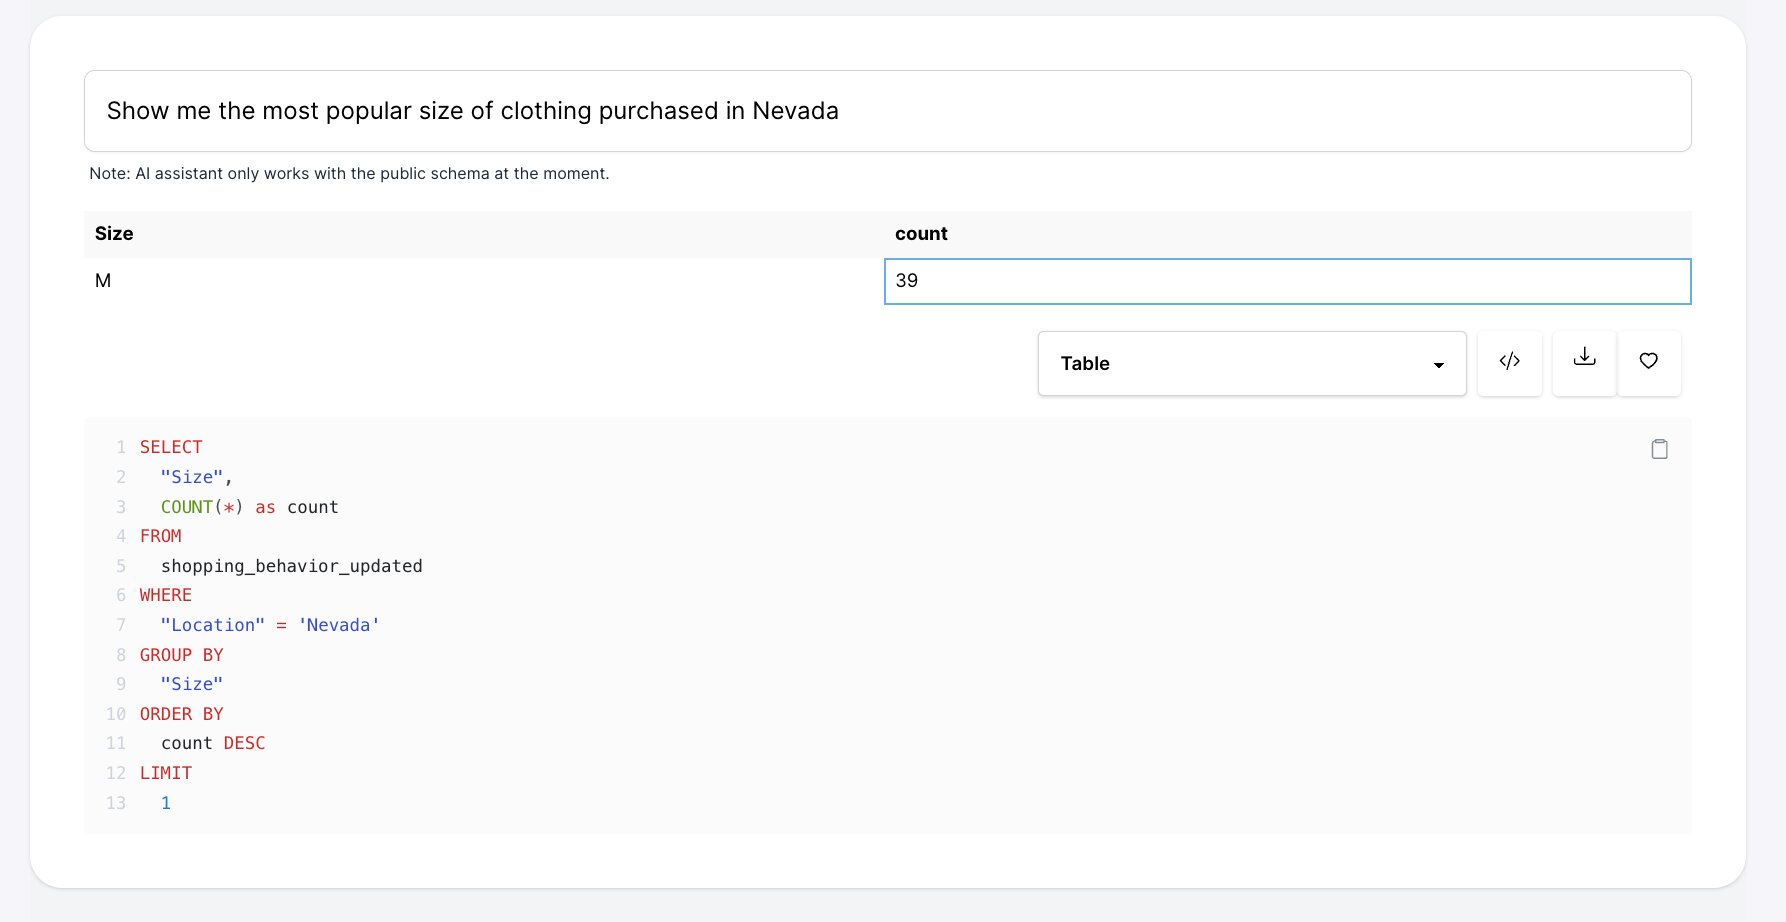
First, let's take a look at the most popular item size in a certain state. This could be very useful for marketing to people in that area!
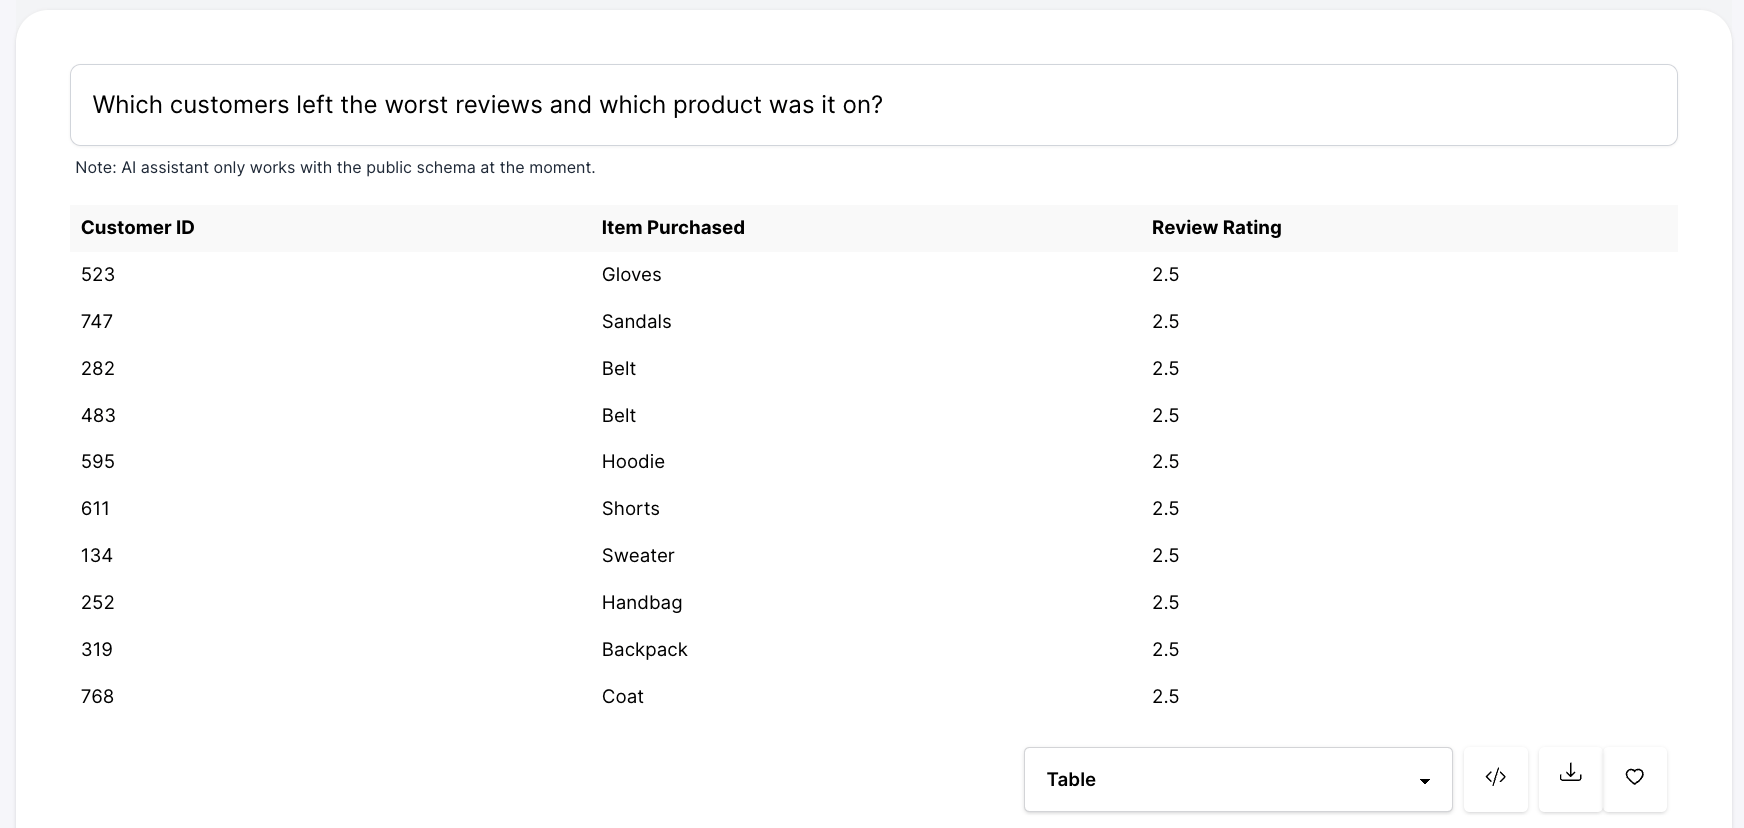
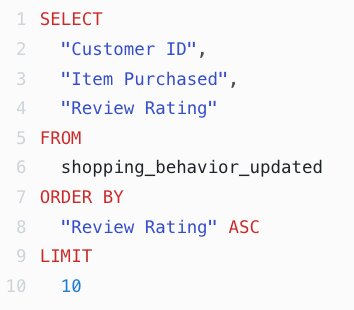
Next, let's look at the top 10 lowest reviewed products and which user left the review. Keeping our products highly rated is integral to maintaining a good company reputation, so it is important to find the products with lower ratings and see what's going wrong.
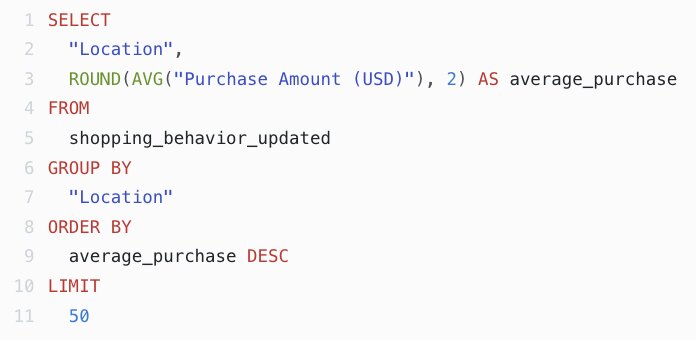
Finally, let's look at the average purchase for each state to determine which of our locations are preforming the best and which are preforming the worst.
Through these examples, you've seen how ChatDB and our No SQL solution to database queries can help you understand your own database.
Conclusion #
Using ChatDB, we were able to analyze our customer's data and make informed decisions based off of the data.
Follow us and stay tuned for more data analysis using ChatDB and updates coming very soon!